HRIT GOES!
Several years ago, I watched a video that kick-started my interest in satellite communications. It was none other than The Thought Emporium. I collected hardware over the years according to this other guide, and made a few fruitless attempts at receiving data from GOES 16. But after finding success with HRPT signals, it was time to try again.
A review of the hardware used:
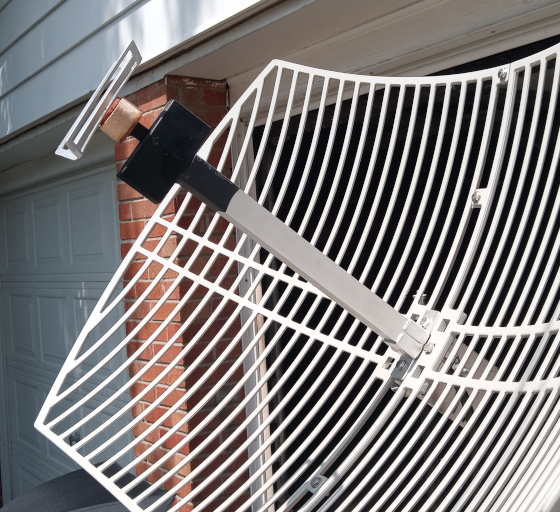
- 2.4 GHz wifi grid antenna
- 2.5 cm spacer for the reflector
- SDR (I used SMArTee)
- LNA/Filter (I used SawBird GOES+)
- USB extension
- Laptop running SatDump
- Phone running Look4Sat
A photo of the 2.5cm spacer I built to modify the grid antenna’s frequency from 2.4GHz to 1.7GHz.
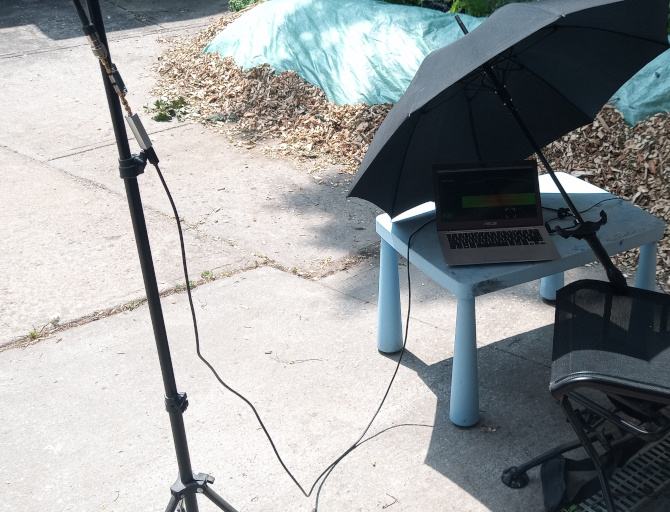
And a photo of a completely professional radio telescope lab. Note that the antenna’s feed is converted to SMA, then run through the lna/filter and directly into the SDR as closely as possible to prevent losses. From there the USB cable extends to the laptop. The USB port provides enough power for both the SDR as well as the lna/filter through Bias-T.
SatDump configuration:
- frequency: 1.6941 GHz
- decimation: 1
- samplerate: 2.56 Mbps
- turn on automatic gain control
- the bias T is automatically enabled in this SDR’s hardware, but you can enable the checkbox.
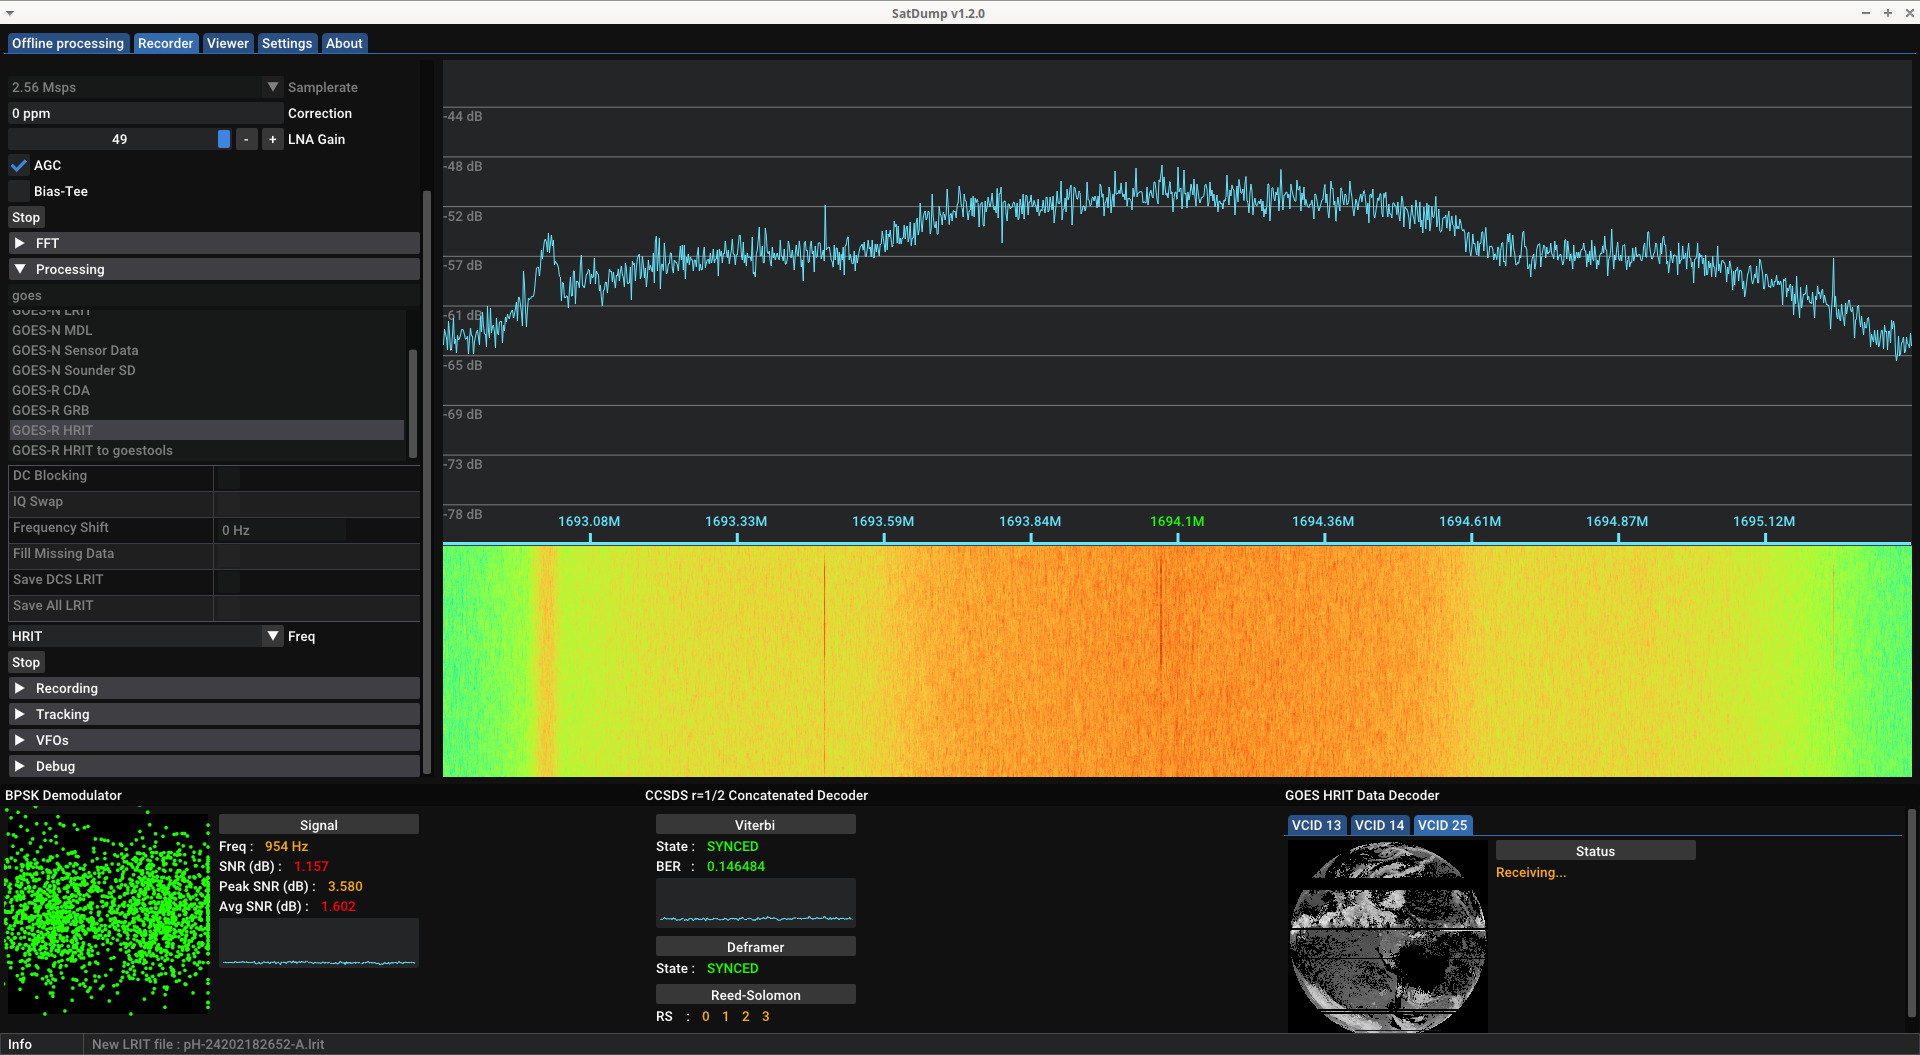
After turning on the SDR open processing, select “GOES-R HRIT”, and click start.
After finding the general direction and skew for the antenna, the aim can be fine tuned by observing the Demodulator graph (bottom left in the following image). The better your reception, the more the dots group into two circles. The signal to noise ratio could definitely use some improvement but this was good enough to scrape some almost-complete data.
Luckily, the signal provides a description of the ensuing data:
The GOES-16 HRIT/EMWIN East broadcast utilizes virtual channels for the transmission of
several simultaneous data streams. The table below identifies the current
virtual channels assignments.

    HRIT/EMWIN
Virtual Channel ID     Group          Product Name
------------------    -------    -------------------------------
        0              Imagery     Admin Text Messages
        1             *Imagery     Mesoscale 0.5 – 2km (ch. 2, 7 and 13)
        2             *Imagery     Band 2 - Visual
        7             *Imagery     Band 7 - Shortwave Infrared
        8             *Imagery     Band 8 – Mid-Level Tropospheric Water Vapor
        9             *Imagery     Band 9 – Upper-level Tropospheric Water Vapor
       13             *Imagery     Band 13 – Clean Longwave Infrared
       14             *Imagery     Band 14 – Infrared Longwave
       15             *Imagery     Band 15 – Dirty Longwave Infrared
       17             *Imagery     Band 13 – GOES-18 4km Clean Longwave Infrared
       20              EMWIN       High Priority
       21              EMWIN       Graphics
       22              EMWIN       Low Priority
       24              Imagery     NHC Maritime Graphic Products
       25             *Imagery     Other GOES-16 Level II Products
       30              DCS         DCS Admin
       32              DCS         DCS Data New Format

*NOTE* - Data Quality Flags are not made available for any of the GOES Imagery products.

For additional broadcast information or questions please visit https://www.noaasis.noaa.gov/ or contact the
HRIT/EMWIN Broadcast Manager at hrit.manager@noaa.gov.
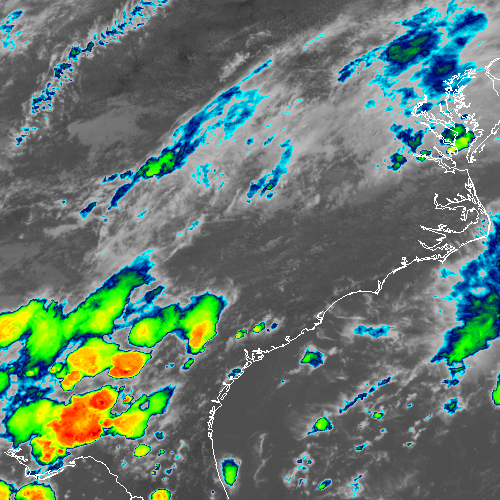
Along with the main sensor data, the stream also includes a bunch of additional data and maps. The South-Eastern USA was considered a priority when this scan took place:
I’m not sure how the schedule works, but sometimes you can also grab images that are relayed from other satellites around the world. A few examples:
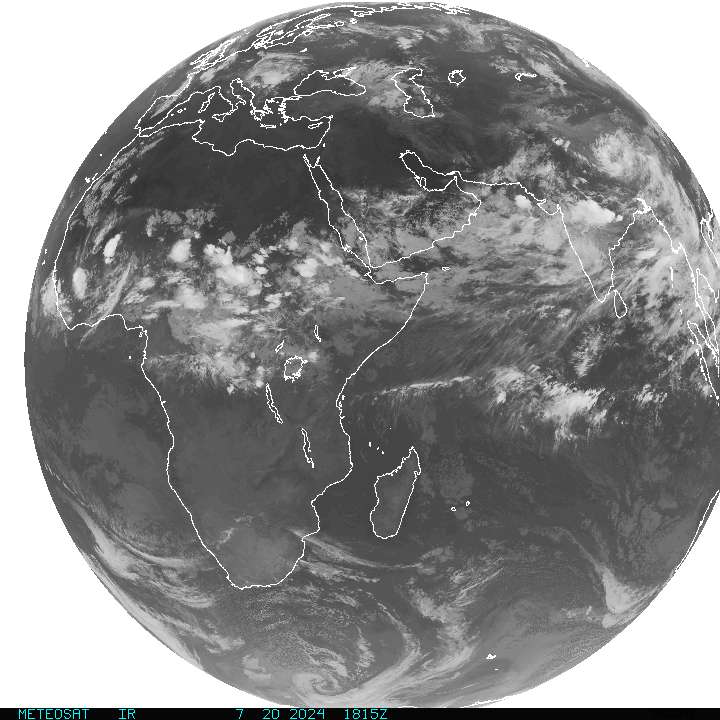
After running the experiment for several hours, there was a wind-related mishap (stay tuned for another post). But for the time I scanned, I was able to pick up several transmissions. It’s a little glitchy and scaled down, but here’s an animation of the false colour images:
 If you look near the centre, you can see the reflection of the sun.
And an animation of the mid-level troposphere water vapour:
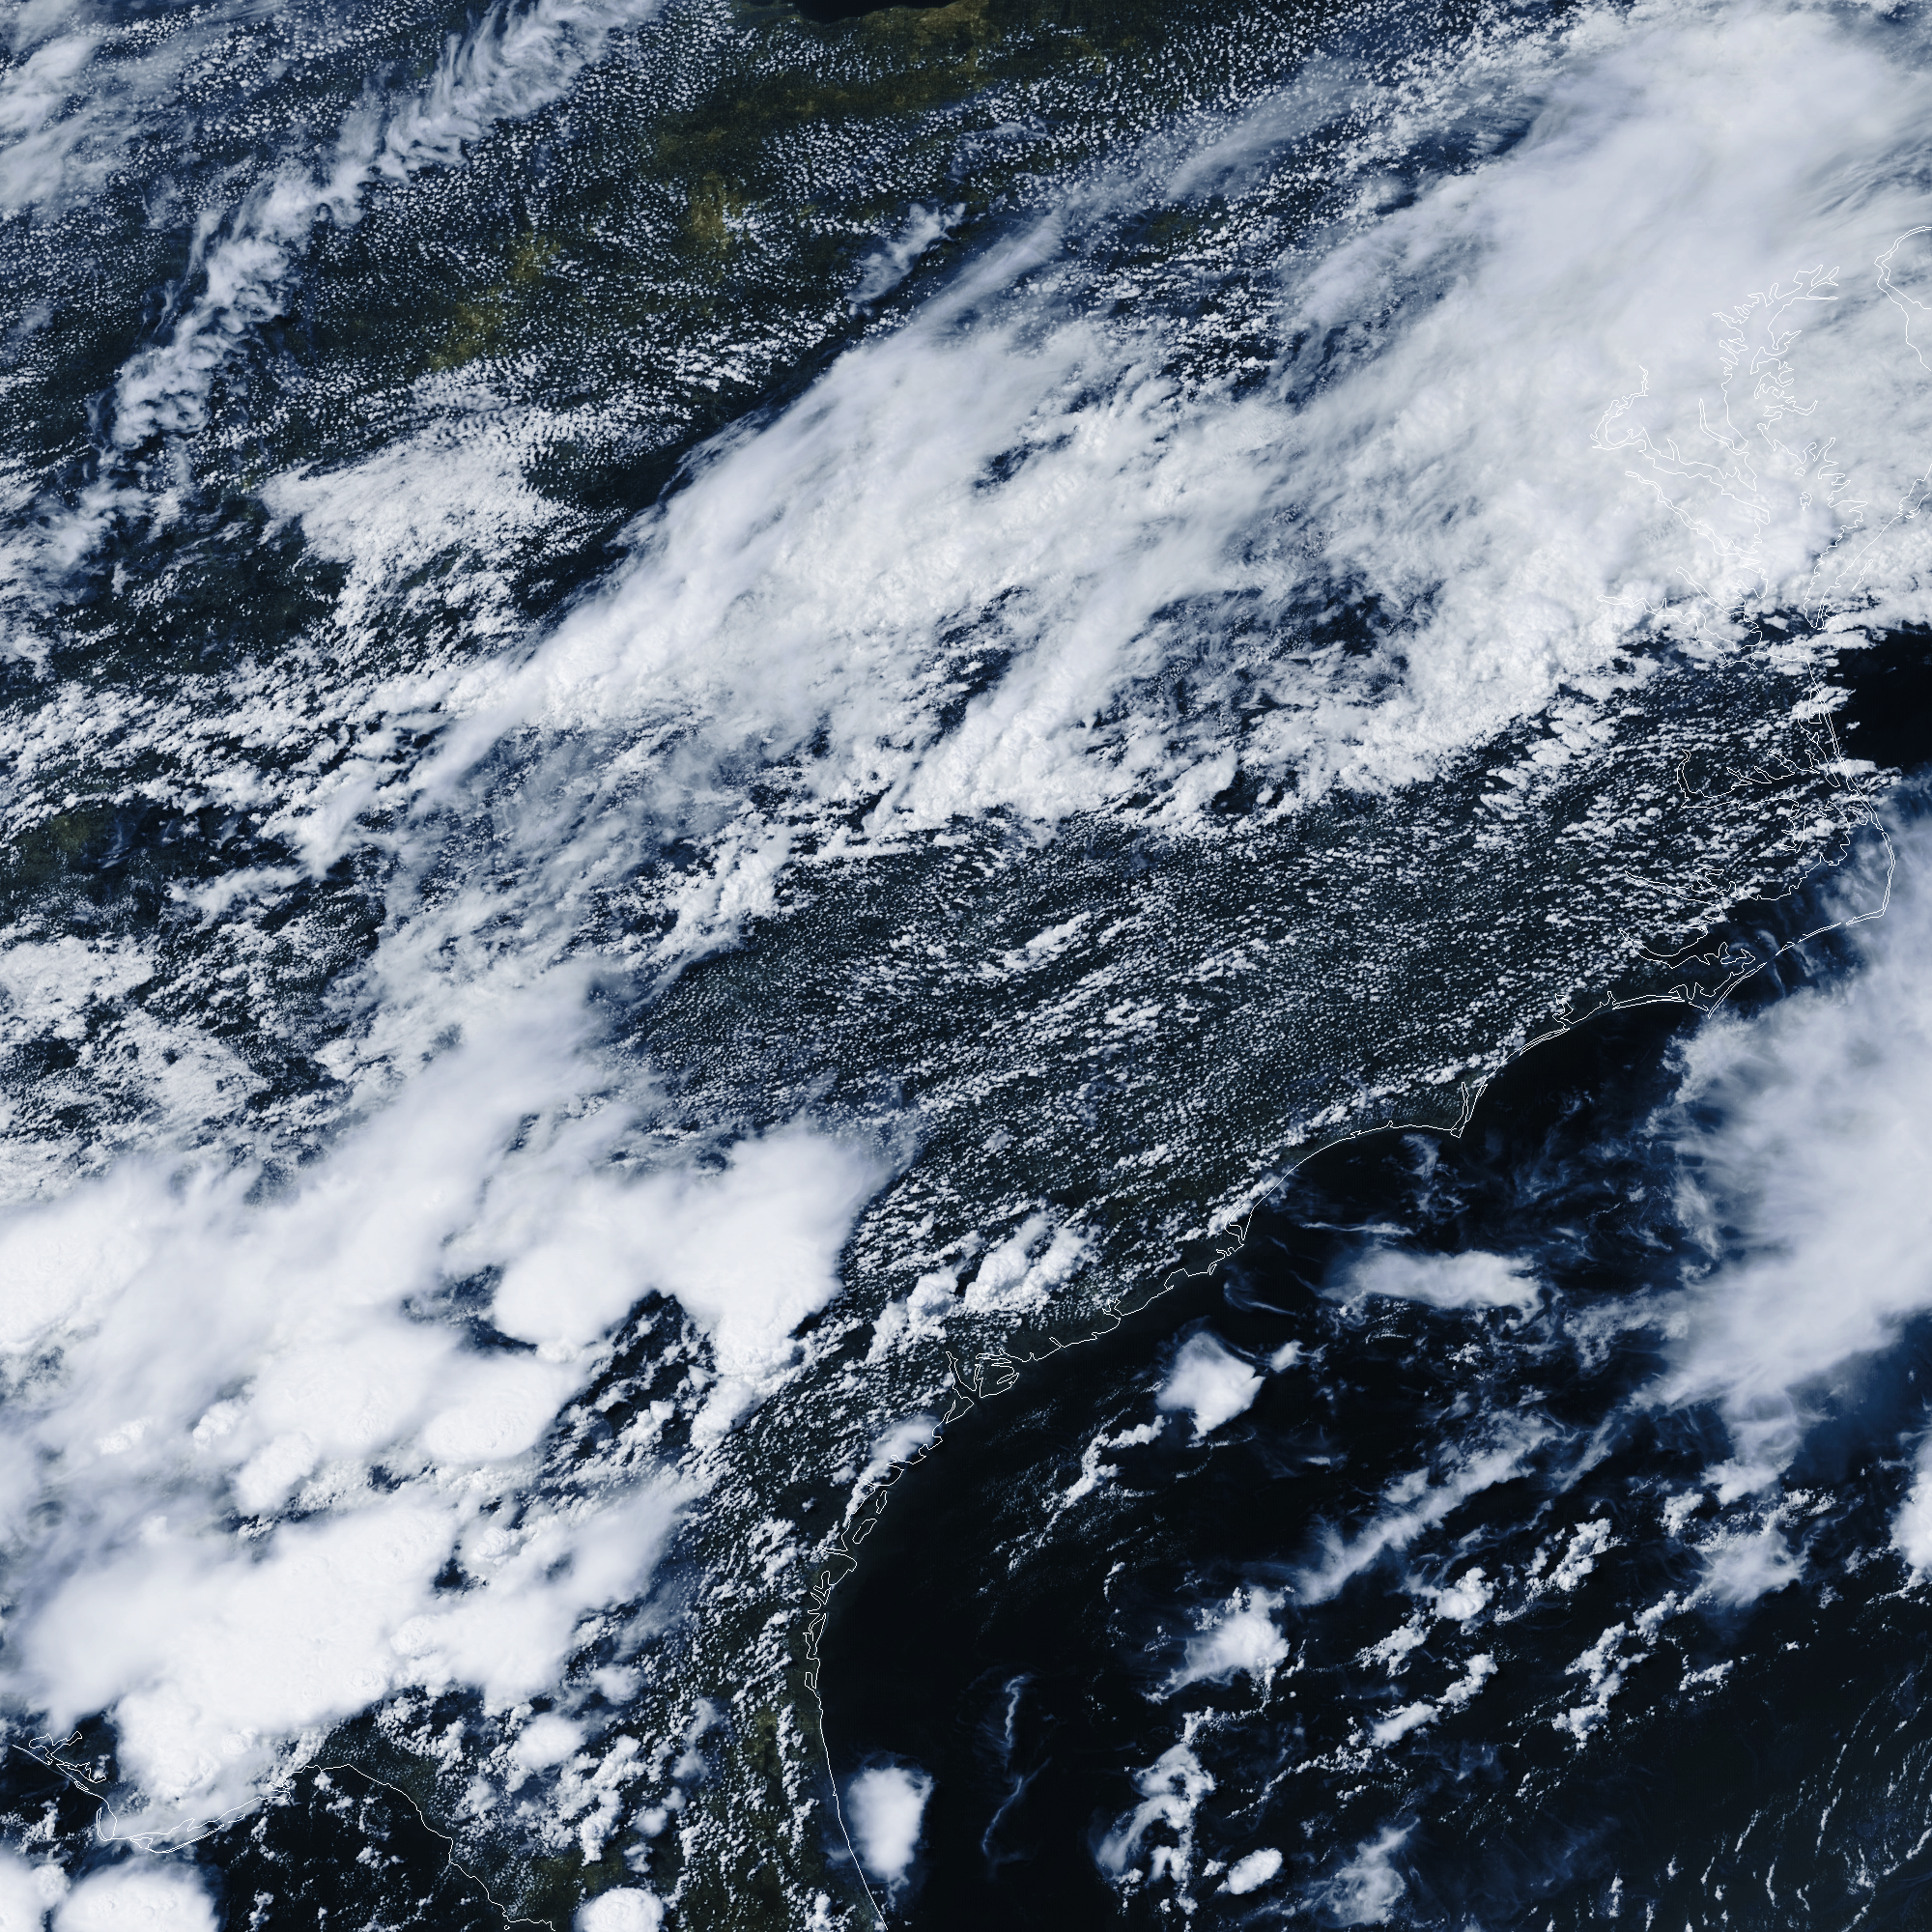
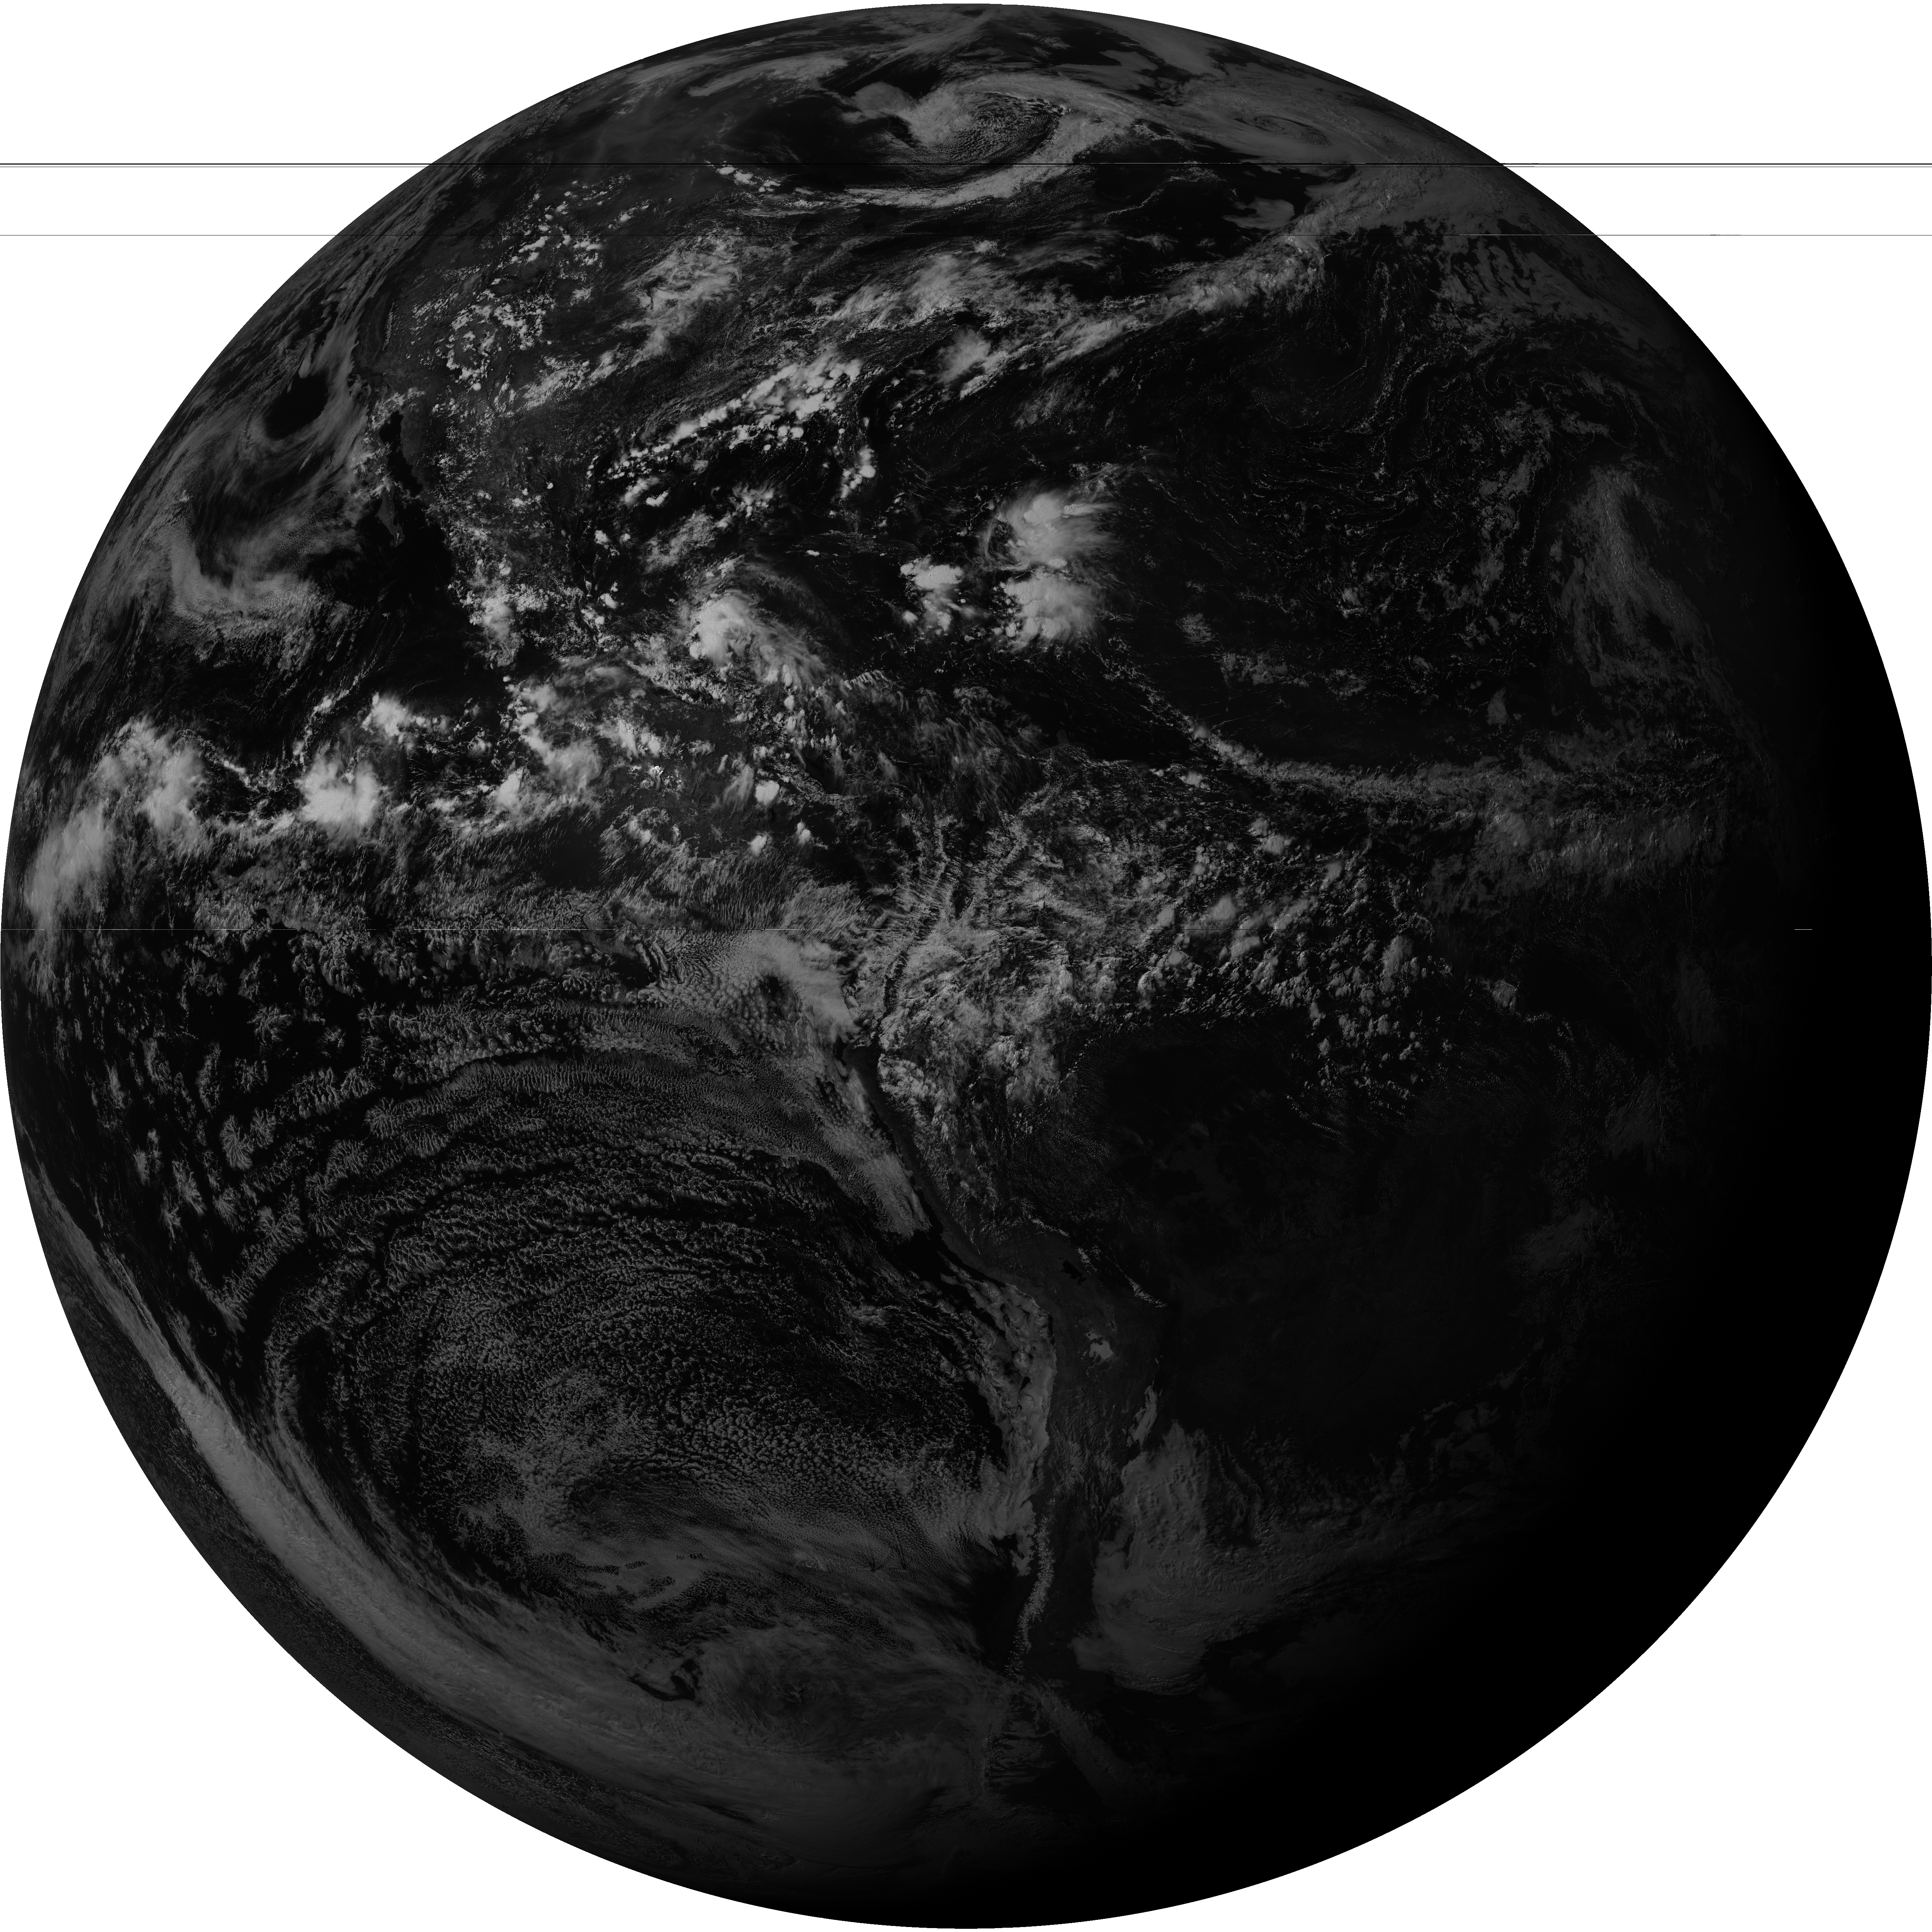
To show the scale and beauty of these results, here are two full-resolution images direct from SatDump. Click on them to open directly.
The grey marble (Band 2 Visible)
The blue marble (false colour)
